|
May 2010
|
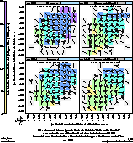
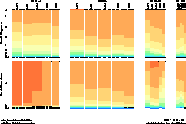
Visualising Twofold Dependencies by Fan Charts
|
|
This fan chart shows the mathematics achievement scores of 7185 students, in dependence on the socio-economic status of the students as well as off the school.
|
2010-01
|
|
April 2008
|
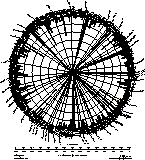
Visualising DRG Patient Spectra by Spoke Plots
|
|
This spoke plot shows the number of cases in 445 DRGs.
|
2008-02
|
|
February 2008
|
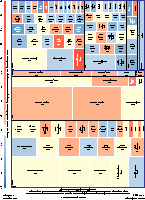
Comparing Expected Lengths of Stay at Pediatric and General Hospitals by Treemaps
|
|
This treemap displays portions of cases per DRG and highlights DRGs with differences between expected lengths of stay found in pediatric hospitals and expected lengths for acute hospitals (15,000 cases in 110 DRGs).
|
2008-01
|
|
February 2008
|
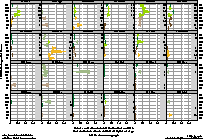
Comparing Patient Spectra by Difference Diagrams
|
|
This difference diagram shows the differences of casemix of one hospital compared to all hospitals of the same type. The differences are displayed for each MDC, differentiated by type (surgical/medical) and by four cost weight classes.
|
2005-03
|
|
February 2008
|
Visualisation of Coding Intensity by Mosaic Displays
|
|
This mosaic display visualises coding intensities for diagnoses and for procedures, by hospital departments, over 5 years.
|
2005-02
|
|
February 2008
|
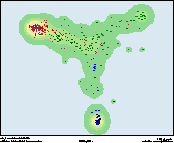
Maps to Show Similar Hospitals Based on DRGs
|
|
This multidimensionally scaled map shows distances of 360 Swiss hospitals with regard to similarity of casemix.
|
2005-01
|
 English Papers
 Beispielgrafiken