Fischer: Abstract: New Methods of Hospital Performance Comparison.
A Workshop Manual for the Visualisation of DRG-based Data.

Z I M - Abstract 2005(1)       June 2005

Abstract:
New Methods of Hospital Performance Comparison

Wolfram Fischer

Zentrum für Informatik
CH-9014 St. Gallen (Switzerland)
http://fischer-zim.ch/


A Workshop Manual for the Visualisation of DRG-based Data

Details
»   main page
»   short description
»   table of contents
Abstracts in other languages:
»    Krankenhaus-Betriebsvergleiche (Zusammenfassung)
»    Comparaison des hôpitaux (Résumé)
»    Malsanulej-komparoj (Koncizigo)
Navigation
 î  ZIM home
 î  navigation tables
 î  sitemap
 î  abbreviations
English Abstracts
^ index
 
>   Base DRGs, Fractionation Coefficient, and Treemaps
Related Links
»   Example Graphics
»   Base DRGs, Fractionation Coefficient, and Treemaps
 
»   DRG Family


Abstract (English)

1


The implementation of DRG systems (DRG = Diagnosis Related Groups) and most various data collections from hospitals have made available large amounts of medico-economic data. Such data, however, may only serve as a basis for managerial and political decision-making if they can be viewed, compared and assessed in context. The graphic methods presented in this book are intended to contribute to this discussion and to underpin the economic assessment of hospitals.

2


At the beginning of the book, a comprehensive example of a hospital performance comparison is presented and commented upon. Further chapters explain the three steps that are necessary for hospitals to be compared with each other. These are based on the following working questions:

  1. How can a hospital be described?
  2. How can similar hospitals be discovered?
  3. What indicators and graphs allow for comparisons between hospitals that provide a genuine basis for discussion?

3


Since there is no one single indicator with which a hospital can be assessed adequately, a set of relevant indicators was established. Some of the graphs used were developed specially, thus the «difference diagram», whose smallest unit makes it possible to display the positions and the comparison of three values and the «sequence diagram», which indicates the positions and the changes in several consecutive values with minimum space requirements. A hospital map was drawn up which employs spatial metaphors such as are used in geographical maps. On the hospital map, those hospitals which show a similar casemix are situated close to each other. Moreover, graphic techniques were used which are already well-known in other spheres, in particular mosaic displays, trellis displays (lattice graphics), and treemaps.

4


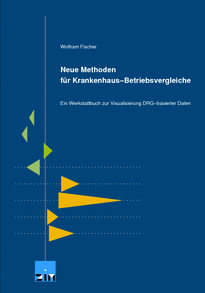
  Wolfram Fischer:
Neue Methoden für Kranken­haus-Betriebs­vergleiche
Ein Werkstattbuch zur Visualisierung DRG-basierter Daten

Gleich zu Beginn ist in diesem Buch ein umfassendes Beispiel eines Kranken­haus-Betriebs­vergleichs zu finden. Anschliessend werden Schritt für Schritt Lösungen zu den folgenden Fragen präsentiert: 1. Wie lässt sich ein Krankenhaus beschreiben? 2. Wie können ähnliche Krankenhäuser ermittelt werden? 3. Welche Kennzahlen und Grafiken ermöglichen diskussionsfähige Krankenhausvergleiche? Dazu werden neuentwickelte «dichte» Grafiken verwendet.

Wolfertswil 2005 (ZIM): 160 pp. / 30 x 21 cm / 109 figures and tables
ISBN 978-3-9521232-8-7
/ SFr. 17.00 / € 17.00

Bestellmöglichkeiten:

  • Internet-Shop für die Schweiz: Verlagshaus, Schwellbrunn.
  • E-Post an den - Verlag.
  • Z I M  –  Zentrum für Informatik
    CH-9014 St. Gallen, Oberstrasse 281a, Switzerland
    E-mail: , Tel: 0041 71 3900 444

    ©  Z I M 
    Source = http://fischer-zim.ch/abstracts-en/Hospital-Comparison-0506-abst-en.htm
    ( latest compilation: 21.03.2019 )